Characterising the Landscape: Auger Survey
Fieldwork
The auger surveys were conducted using a 30mm bore hand auger, with a sample tube 500mm in length. At each sample point the auger was pushed into the ground, rotated by 180° to cut the sample, and withdrawn. Where deposits were greater than 500mm in depth the process was repeated until the required depth had been reached, if necessary fitting extension rods above the sample tube to enable deeper penetration. The surface of the sample column recovered was cleaned by knife or trowel and examined. Each discrete deposit evident within a sample was documented on an individual context basis, with attributes such as colour, texture, inclusions, and depth below ground level being recorded. These details were entered into a relational database on a Palm OS handheld computer in the field. The image below shows a very clear interface between plough-soil (left) and wind blown sands (right) in one of the augers.

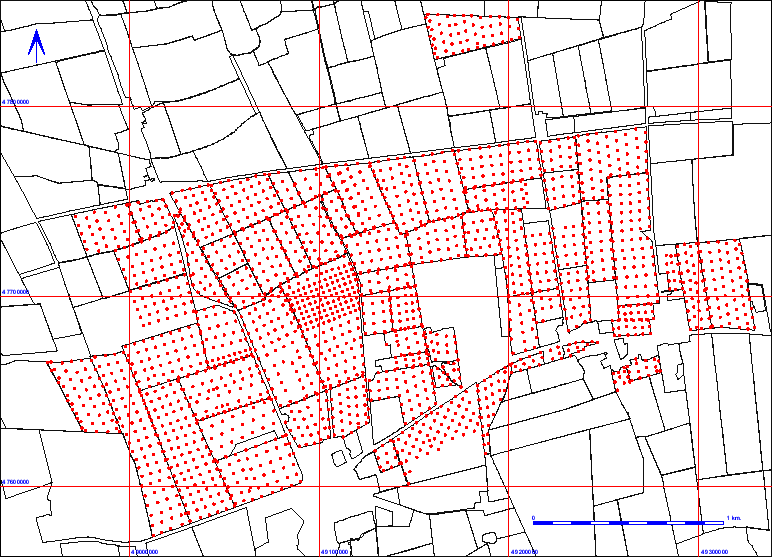
The samples were recovered on a site by site basis, each site being sampled on a paced grid with approximately 50 metres between samples. The grid spacing was varied occasionally dependant on conditions and the deposits encountered; for example areas of standing water were avoided, as were areas directly under vegetation that might prevent the auger location being surveyed. As augering progressed the points at which samples had been taken were marked with flags, and on completion of each site those positions were located using a Leica 500 System GPS (see Topographic Survey) The figure below illustrates the overall distribution of auger samples within the Aggregates Levy Sustainability Fund project area.

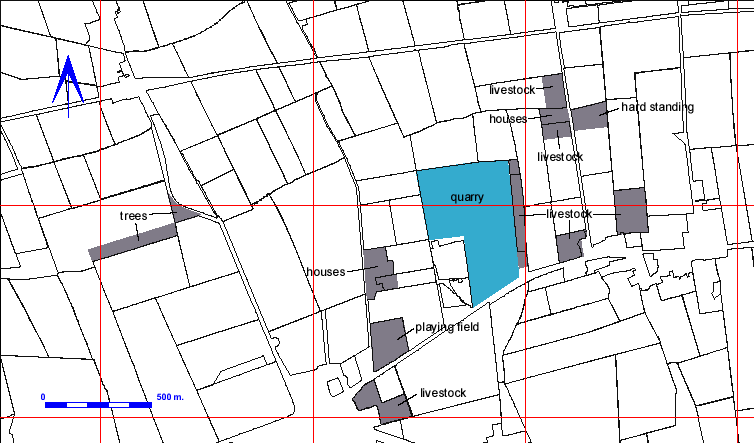
The availability of fields in which to undertake the auger survey was dependent on crops and livestock etc., and it proved impossible to survey all the fields within the project area due to these constraints. The figure below illustrates those areas that were not available to be augered.

Data Processing
On completion of each site the database on the hand held computer was synchronised with an Access relational database residing on a desktop PC. The data were then evaluated, and the total depth of overburden (combined depth of plough-soil and wind blown sands) calculated for each sample. The survey data locating each auger was also imported, and the co-ordinates for the top of individual context within the auger calculated and added to the database.
The interpretation of some of the samples in the field proved difficult, particularly when a number of deposits of similar colour and texture with diffuse interfaces were encountered. As a result some of the data recorded in the field showed inconsistencies, for example the depths of overburden over a particular site may have been consistently in the region of 40-50cm, but one or two samples may have indicated much greater depths. In such cases, the sample points and their associated overburden depths were plotted over the geophysical survey results. Where a sudden increase in depth corresponded with an archaeological feature identified by the geophysics, it was assumed that the auger sample had been misinterpreted, and that a feature had been encountered. When this occurred the value for the depth of overburden was altered to reflect this, generally being allocated the average of the surrounding sample points. Anomalies such as these that did not correspond to features in the geophysics may also have encountered archaeology, but when this occurred the data have been left unaltered. This has resulted in occasional areas of apparently deeper overburden in the models, but it was felt that editing the data to this extent would not have been tenable.
Once the data had been evaluated the overburden depths for each site were extracted from the database as CSV files (comma separated values). The overburden data were imported into G-Sys on a site by site basis, and interpolated using a Delauney tessellation to produce the plots of overburden included in the various site dossiers. Subsequently the individual site overburden triangulations were loaded into G-Sys together to create a landscape wide model of the overburden depths. This model was then used with the geophysical survey interpretive plot to develop new models reflecting the density of archaeology and more generalised maps to reflect risk from plough damage.
In addition to the overburden models, the data were used to create simple multi-layered models defining three surfaces; plough-soil, archaeology, and natural. The plough-soil and natural surfaces, being present at every sample point, were created very simply by triangulating each point with that classification. Deposits classified as archaeology, however, were not present at every sample point. To create the potential archaeology model, the depth of overburden at each sample location was subtracted from the ordnance datum height at the top of the sample, thereby giving an ordnance datum height defining the base of the overburden. These values were exported from the database and processed in G-Sys in the same manner as the other surfaces.
|
